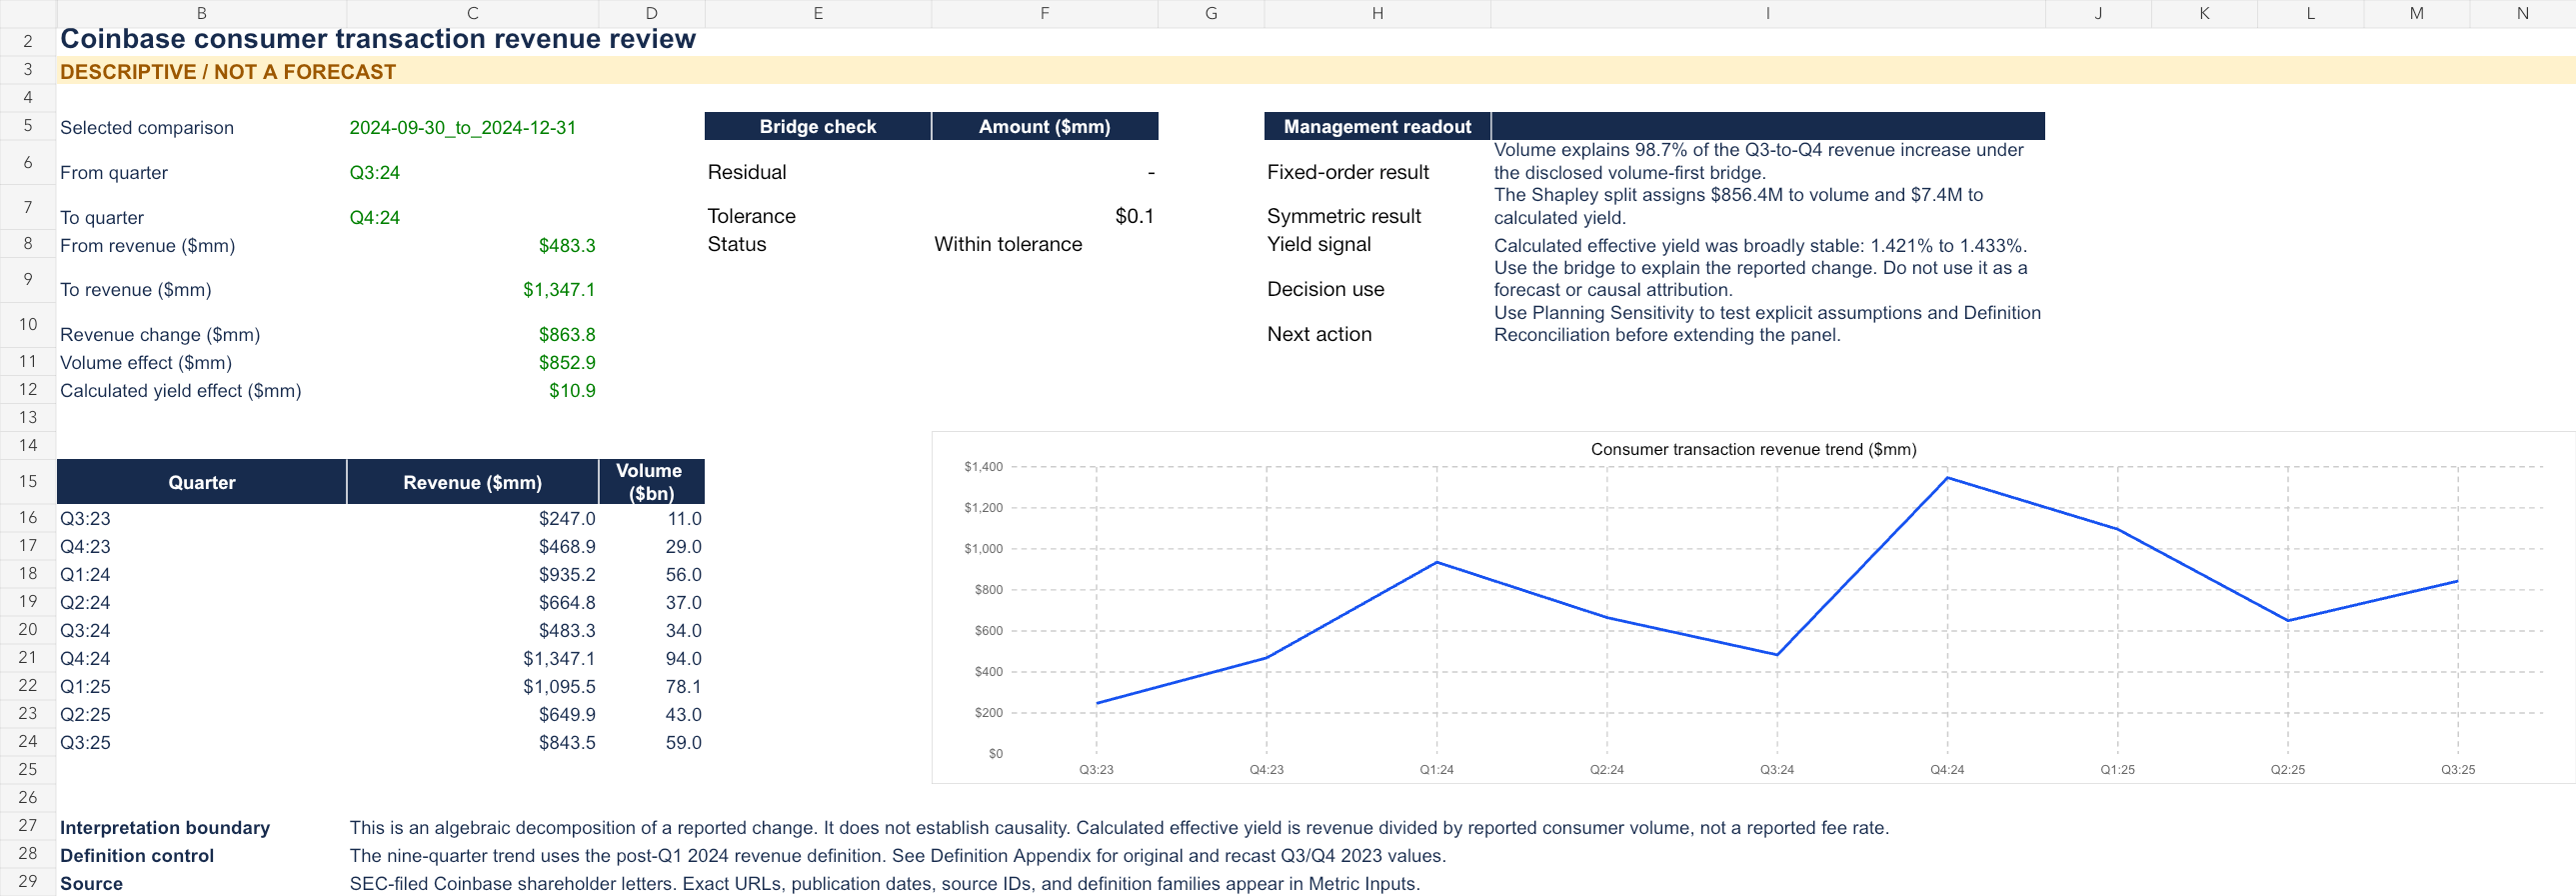
Q3 to Q4 2024
Three valid bridge orders
The interaction term moves depending on factor order. The symmetric Shapley method averages both valid orders instead of hiding the choice.
Bars show the volume component as a share of the $863.8M change. They do not show causal contribution.
Illustrative planning sensitivities
| Case | Volume change | Yield change | Implied revenue | Management prompt |
|---|---|---|---|---|
| Downside | -20% | -10 bps | $1,002.5M | Investigate activity retention and mix. |
| Reference | 0% | 0 bps | $1,347.1M | Q4 2024 actual reference; not a forecast. |
| Upside | +20% | +10 bps | $1,729.3M | Test operating readiness and mix sustainability. |
These cases are editable mechanical sensitivities. They are not Coinbase guidance, probabilities, or expected outcomes.
Definition control
The later Q2 2026 deck restated Q2-Q4 2025 consumer spot volumes below earlier disclosures by $1.5B, $1.6B, and $2.3B. The project preserves both vintages and keeps those periods outside the earlier panel.
Reproducible by design
- 13 frozen SEC sources with SHA-256 hashes
- Formula-driven seven-sheet workbook
- One-command SQL reproduction
- Automated definition, cutoff, duplicate, and bridge checks
- Public AI contribution disclosure
Methods note: no forecast
Before looking at results I set a gate of twelve comparable quarters: eight to train and four chronological holdouts. The comparable public panel has nine, bounded by a Q1 2024 revenue reclassification and later Trading Volume definition changes. So this page publishes the bridge and planning sensitivities and makes no forecast-accuracy claim.
Review the evidence
The package is designed to be challenged. Start with the memo, inspect formulas in the workbook, then use the reviewer packet to test the strongest objections.